Math Homework. Do It Faster, Learn It Better.
Circle Graphs
A circle graph is a way to organize data using the sectors of a circle.
Example:
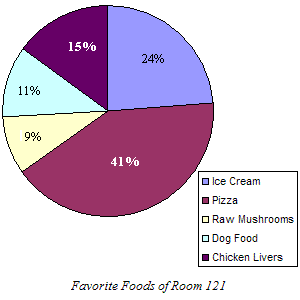
Suppose you take a poll of the students in your class to find out their favorite foods, and get the following results:
- Pizza –
- Ice Cream –
- Raw Mushrooms –
- Dog Food –
- Chicken Livers –
Organize this data in a circle graph.
The data are given as percentages. To make the sectors the right size, you need to use the fact that there are degrees in a circle, and solve some proportions . For example, to find the number of degrees in the sector for chicken livers, you need to solve:
It turns out that , so you need to measure a degree sector to represent the portion of the class that loves chicken liver.


