Graphing Logarithmic Functions
The function is the inverse function of the exponential function .
Consider the function . It can be graphed as:
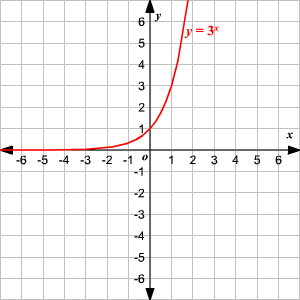
The graph of inverse function of any function is the reflection of the graph of the function about the line . So, the graph of the logarithmic function which is the inverse of the function is the reflection of the above graph about the line .
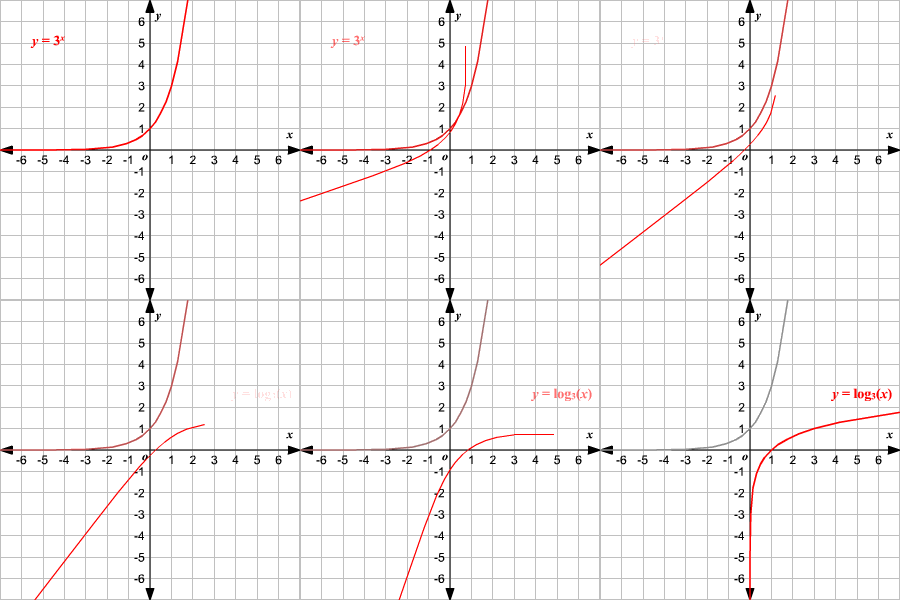
The domain of the function is the set of all positive real numbers.
When no base is written, assume that the log is base .
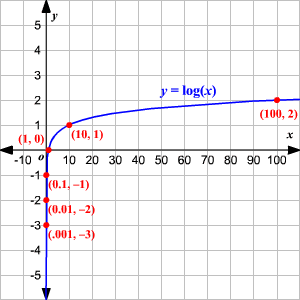
The logarithmic function, , can be shifted units vertically and units horizontally with the equation .
Vertical shift
If , the graph would be shifted upwards.
If , the graph would be shifted downwards.
Horizontal Shift
If , the graph would be shifted left.
If , the graph would be shifted right.
Consider the logarithmic function . This can be obtained by translating the parent graph a couple of times.
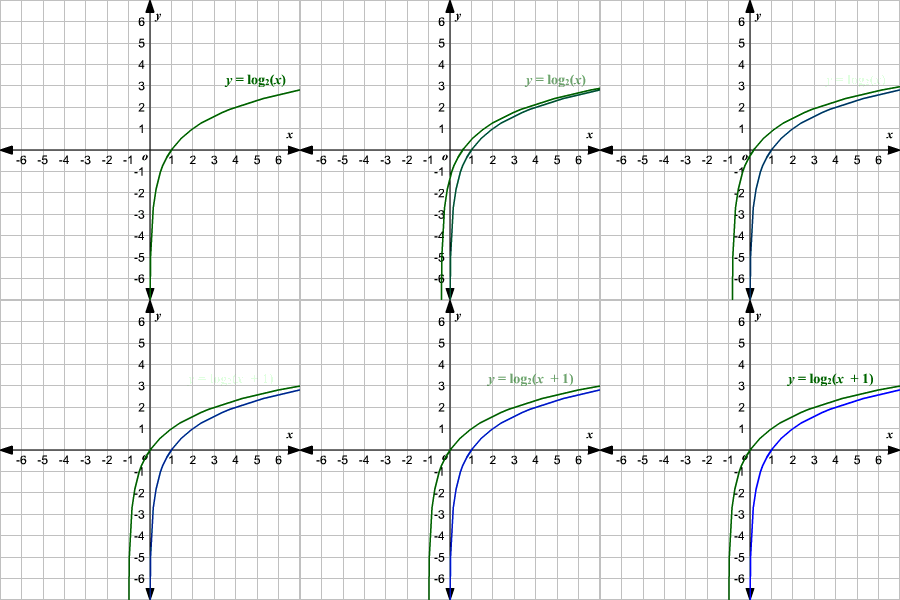
Consider the graph of the function .
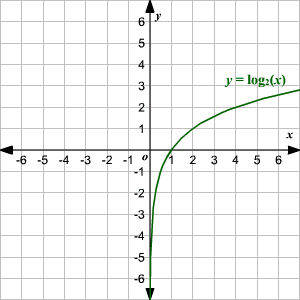
Since , is the translation of by one unit to the left.
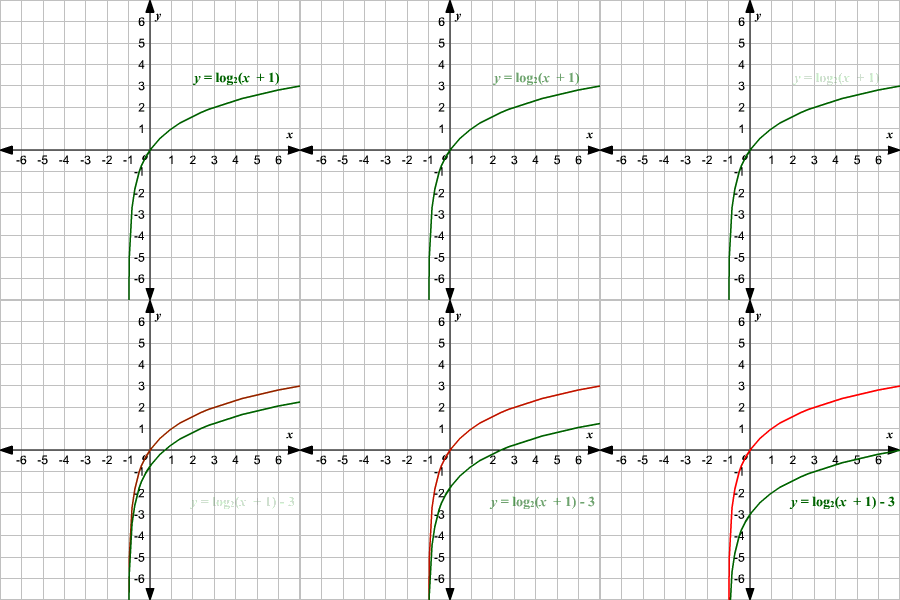
Now, . The graph of will be shifted units down to get .
You may recall that logarithmic functions are defined only for positive real numbers. This is because, for negative values, the associated exponential equation has no solution. For example, has no real solution, so is undefined.
So, what about a function like ?
This is defined only for negative values of .
Find the values of the function for a few negative values of . For an easier calculation you can use the exponential form of the equation, .
Plot the points and join them by a smooth curve.

You can see that the graph is the reflection of the graph of the function about the -axis.


