Graphing Quadratic Inequalities
A quadratic inequality of the form
(or substitute or for ) represents a region of the plane bounded by a parabola .
To graph a quadratic inequality, start by graphing the parabola. Then fill in the region either above or below it, depending on the inequality.
If the inequality symbol is or , then the region includes the parabola, so it should be graphed with a solid line.
Otherwise, if the inequality symbol is or , the parabola should be drawn with a dotted line to indicate that the region does not include its boundary.
Example:
Graph the quadratic inequality.
The related equation is:
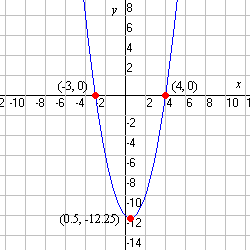
First we notice that , the coefficient of the term, is equal to . Since is positive, the parabola points upward.
The right side can be factored as:
So the parabola has -intercepts at and . The vertex must lie midway between these, so the -coordinate of the vertex is .
Plugging in this -value, we get:
So, the vertex is at .
We now have enough information to graph the parabola. Remember to graph it with a solid line, since the inequality is "less than or equal to".

Should you shade the region inside or outside the parabola? The best way to tell is to plug in a sample point. is usually easiest:
So, shade the region which does not include the point .


