Line of Best Fit (Least Square Method)
A line of best fit is a straight line that is the best approximation of the given set of data.
It is used to study the nature of the relation between two variables. (We're only considering the two-dimensional case, here.)
A line of best fit can be roughly determined using an eyeball method by drawing a straight line on a scatter plot so that the number of points above the line and below the line is about equal (and the line passes through as many points as possible).
A more accurate way of finding the line of best fit is the least square method .
Use the following steps to find the equation of line of best fit for a set of ordered pairs .
Step 1: Calculate the mean of the -values and the mean of the -values.
Step 2: The following formula gives the slope of the line of best fit:
Step 3: Compute the -intercept of the line by using the formula:
Step 4: Use the slope and the -intercept to form the equation of the line.
Example:
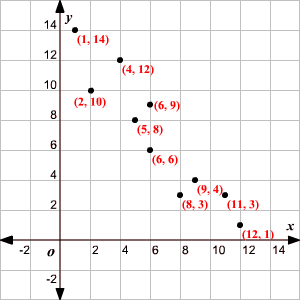
Use the least square method to determine the equation of line of best fit for the data. Then plot the line.
Solution:
Plot the points on a coordinate plane .

Calculate the means of the -values and the -values.
Now calculate , , , and for each .
Calculate the slope.
Calculate the -intercept.
Use the formula to compute the -intercept.
Use the slope and -intercept to form the equation of the line of best fit.
The slope of the line is and the -intercept is .
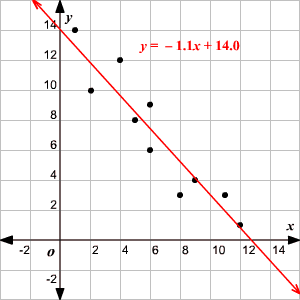
Therefore, the equation is .
Draw the line on the scatter plot.


